

Your analytics data is lying to your recommender
About this series. We are building a recommendation engine from scratch on Google's own store data — the public GA4 export of the Google Merchandise Store, the dataset used in most recommender tutorials — and publishing what comes out, including what does not work. The question behind the series: does a recommendation engine add 2% or 12% to a shop's revenue, and how would you know? This is part 1: the data foundation.
Before a recommendation model can learn anything, somebody has to build the table it learns from: which customer interacted with which product, how, and when. It sounds like plumbing. It is where the real decisions live. We built that table from Google's own e-commerce analytics export, and two things fell out of it that would have quietly corrupted every model trained on top.
13.6×more "product views" in the export than customers actually made
1,231 → ~400product IDs in the export vs. actual products
9different IDs for one crewneck sweatshirt — one per size
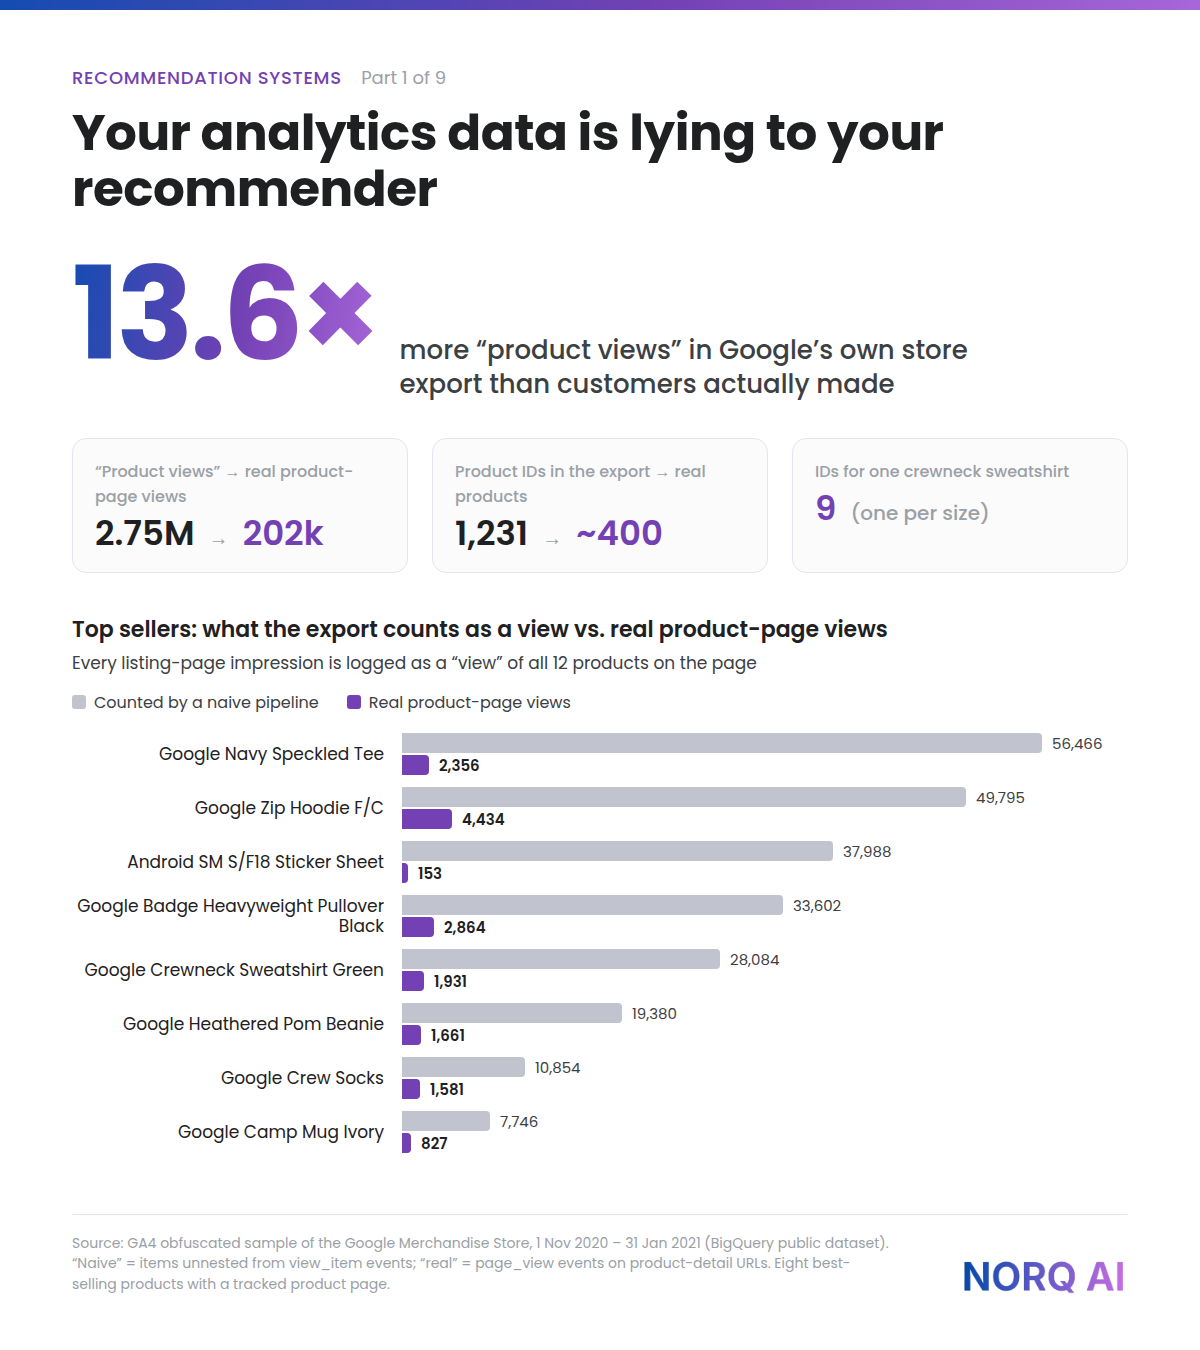
Finding 1: a "view" was not a view
Google Analytics 4 records a view_item event when a shopper looks at a product,
and each event carries a list of the products involved. The obvious way to build an
interaction table is to unpack that list: one row per product per event. Do that on this
export and you get 2.75 million product views over three months — for a store with
about 400 products.
The catch: 97% of those events carry twelve products, not one. The store's tracking
fires a view_item for every listing page, with the whole page of products
attached. A shopper who opens the "Apparel" page has just "viewed" twelve items. A sticker
sheet that sat on a popular listing page for three months has 38,000 views and 153 people
who actually opened its page. The same is true of the add-to-cart event: it carries the
page's twelve products, with the item that was actually added marked only by a quantity
field.
These are impressions, not views. They are useful — knowing what the shop showed is exactly what you need later to judge recommendations fairly — but as a signal of interest they are noise. The real product views were somewhere else entirely: ordinary page-view events on product-page URLs, matched to the catalogue by page title. That gave 202,000 views from 56,000 visitors, and the bestseller list suddenly agreed with the most-viewed list.
Finding 2: one sweatshirt, nine identities
Every product in the export has an ID. It is not the same ID everywhere. On view events the
ID is a product code (GGOEGXXX0913); on purchase events it is a numeric variant
code, one per size or colour; add-to-cart events mix both. The "Google Crewneck Sweatshirt
Grey" appears under nine IDs. Join views to purchases on the ID and the top-selling products
show zero views, because nothing matches.
The only key that was stable across every event was the product name. So the warehouse keys products by a normalised name and keeps the raw IDs as a lookup, which collapses 1,231 IDs to roughly 400 products. That is a modelling decision made in the data layer, and it matters more than the choice of algorithm: with the wrong key, every model sees a catalogue three times larger than the real one, with each product's history split across strangers.
Finding 3 arrived the next day
With the table built, we ran the simplest recommender there is — "customers who viewed this also viewed" — and asked it about a pair of socks. It suggested toddler onesies, with 75% of sock-viewing sessions also viewing them. That number is too good to be human. It was not: 1,054 sessions had each opened fifty-odd product pages in about fifteen minutes, cycling through the same twenty page lists, and never bought anything. A crawler, active from 1 November until it stopped on 14 December. It was 1.6% of sessions and 29% of all product-page views, and Google's anonymisation of the dataset had left it intact.
Flagged and excluded, the same query returned other socks. The model did not change. The data did. We tell that story in its own short piece; the point here is that it was caught by looking at what a model recommended for one product, not by any metric.
What this means for your shop
Nothing above is a fault of Google's. It is what production tracking looks like: events implemented by different people at different times, an ID scheme that drifted, and traffic that is not customers. Every shop's export has its own version of it. The question worth asking is simple: if a recommendation engine was trained on your analytics export as-is, what did it learn?
The fix is not a better algorithm. It is owning the data foundation — a curated interaction table in your own warehouse with one product key, one definition of "view", and an explicit flag for traffic that is not shoppers — before anyone trains anything. Three practical consequences:
Under the hood — for the technically curious
The warehouse is BigQuery, transformed with Dataform in layers (raw → staging → curated). The recommender reads two curated tables: a product dimension keyed by normalised name, and an interaction fact with one row per (visitor, session, product, interaction type, timestamp), where the type is an ordered funnel — impression, view, click, cart, checkout, purchase — and a boolean marks crawler sessions. Models pick their own weights; the warehouse only promises the definitions.
Real product views are page-view events on product URLs, resolved through the page title:
SELECT
  user_pseudo_id, event_ts, session_key,
  LOWER(REGEXP_REPLACE(page_title, r'[^A-Za-z0-9]', '')) AS item_key
FROM stg_ga4_events
WHERE event_name = 'page_view'
  AND REGEXP_CONTAINS(page_location, r'(?i)/google\+redesign/[^/?#]+/[^/?#]+')
  AND page_title NOT LIKE '%|%'          -- category pages: "Hats | Apparel | ..."
  AND page_title NOT IN ('Home', 'Page Unavailable')
A six-entry alias list covers products whose page title differs from their catalogue name;
with it, 99% of product-page views resolve to a catalogue product. The added item inside a
twelve-product add-to-cart event is the single element whose quantity is not
null. The crawler rule is deliberately plain — fifty or more distinct product pages in
a session and no purchase — and lives in one staging table so that every downstream
model inherits the same definition.
And the recommender that exposed the crawler, in full:
WITH baskets AS (
  SELECT DISTINCT session_key, item_key
  FROM fct_user_item_interactions
  WHERE interaction_type = 'view' AND NOT is_suspected_bot
),
item_counts AS (SELECT item_key, COUNT(*) AS n FROM baskets GROUP BY 1),
total AS (SELECT COUNT(DISTINCT session_key) AS n_sessions FROM baskets),
pairs AS (
  SELECT a.item_key AS item_a, b.item_key AS item_b, COUNT(*) AS n_ab
  FROM baskets a JOIN baskets b
    ON a.session_key = b.session_key AND a.item_key != b.item_key
  GROUP BY 1, 2 HAVING n_ab >= 10
)
SELECT item_a, item_b, n_ab,
  n_ab / ca.n                          AS confidence,   -- P(b | a)
  (n_ab / ca.n) / (cb.n / t.n_sessions) AS lift          -- vs. base rate of b
FROM pairs
JOIN item_counts ca ON ca.item_key = pairs.item_a
JOIN item_counts cb ON cb.item_key = pairs.item_b
CROSS JOIN total t
ORDER BY lift DESC
Thirty lines, no training loop, and a perfectly respectable "frequently bought together" when run on purchases instead of views. It is the baseline every later model in this series has to beat.
Data and licence
bigquery-public-data.ga4_obfuscated_sample_ecommerce — the obfuscated GA4
export of the Google Merchandise Store, 1 November 2020 to 31 January 2021, published by
Google through the Cloud Public Datasets Program for learning and demonstration. 4.3 million
events, 270,000 anonymous visitors, about 400 products. The analysis scanned roughly 10 GB
in BigQuery, inside the free tier.
Next in the series: the simplest models that work — popularity, co-occurrence and item similarity — and how to measure them honestly before anything touches the shop. Related: Your customer acquisition cost is judged against the wrong number, part 1 of our customer-lifetime-value series.
Start Your Data Transformation Journey
Discover practical, scalable solutions tailored to your business priorities.